Fremont Real Estate Market Update: July 2026

Happy July 4th! This weekend marks America’s 250th birthday, a major milestone that naturally prompts a bit of reflection on where we’ve been and where we’re headed. When you look back at that kind of history, it's a reminder that communities are built over generations, shaped by the families and individuals who invest their lives and futures into them. The East Bay is a perfect example of that unfolding story, having grown from a collection of quiet towns into one of the most dynamic, sought after housing markets in California. In the spirit of tracking how our local neighborhoods are evolving, here is a quick, bite sized look at the latest East Bay numbers before you head out to celebrate.
Lastly, check out my brand new Fremont Super Data Tracker site, designed to bring these local market metrics to life with an interactive, visual display! Feel free to reach out if you have any questions, I'd be more than happy to do a thorough / personalized analysis beyond this data report. You can also check out my website for more resources & guides (www.joshuy.com).
Fremont - Quick takeaways (7/04/26): 📈
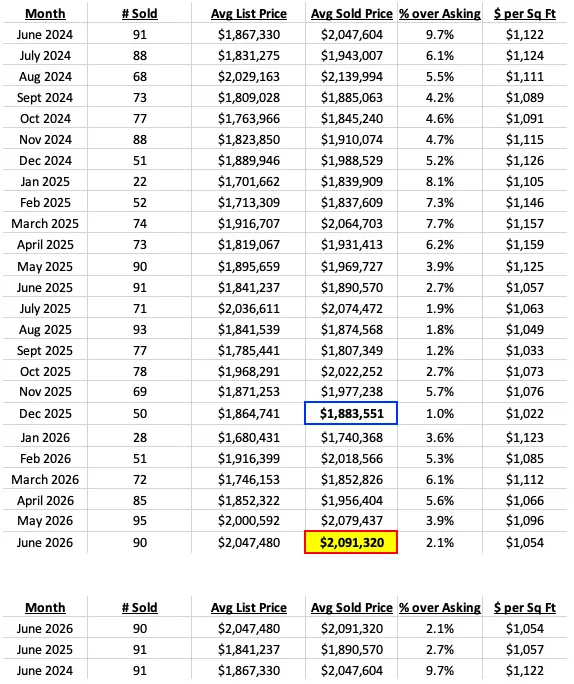
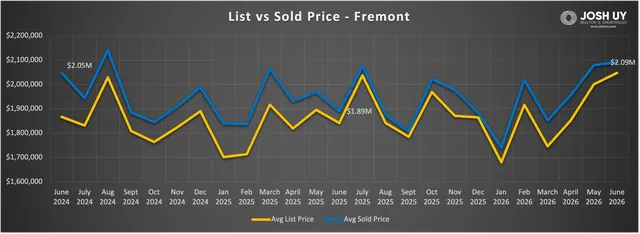
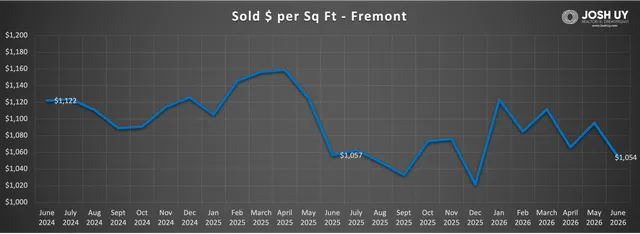
- June 2026 prices - After a modest dip in March, Fremont has continued its impressive trek back into the high $2Ms, with the typical home now selling for $2.09M. Following March's numbers at $1.85M, price has climbed 12.9%, while sold $ / Sq ft dipped 5.2% within that same period. For reference, Fremont hasn't been this close to $2.1M since back in August 2024 (at $2.14M almost two years ago). For the month of June, Fremont had 12 homes that closed above a $3M price, which was another a big jump compared to the 3ish average we have seen over the past few months (vs 9 in May, 3 in April, 3 in March).
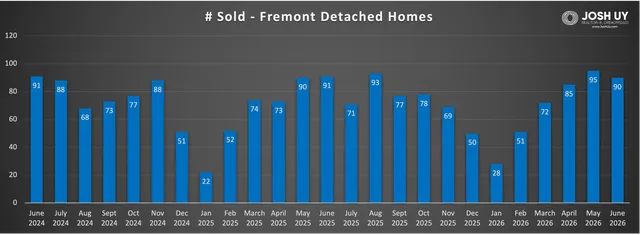
- Price over asking % - Homes in June were generally selling 2.1% above asking, which has been on a steadily decline since the 6.1% figure from March. Of the 90 homes that closed last month, there were 55 selling above list price! Around this time last year, homes were selling at 2.7% over asking, which was followed up by a 1.9% figure for July 2025.
- 6 month change - Price over the last 6 months is up 11% from $1.88M in December 2025, while sold $ / Sq ft had more modest gains at "just" 3.2% over that span (from $1022 to $1054 / Sq ft). Though we fell into the $1.7Ms - $1.8Ms range for a few months from Dec to March, the last two months have pushed us solidly over the $2M level. Note the average for the year so far continues to track upward (now $1.96M for 2026).
- 1 yr change - Year over year, price is up 10.6% from $1.89M in June 2025. Fremont had 90 homes sold this past month, which has been impressively consistent with the last two years (both June 2025 & 2024 had 91 sales).
- See the June sold homes HERE.
Have a great day!
Josh Uy

Sales data was pulled from the Bayeast Association of Realtors MLS (deemed reliable but not guaranteed), then organized by Josh Uy. For more information on how these trends might affect your home values and/or the timing of your real estate moves, please feel free to contact me anytime. You can also visit my website (www.JoshUy.com) which has additional resources for home buyers and home sellers.