Fremont Real Estate Market Update

August brought mixed signals across the local market, with prices and activity shifting with volatility by neighborhood. Much of this comes down to typical late summer seasonality, as low transaction volumes and vacation schedules often create quirky, month to month swings. We also saw fluctuations in the size of homes sold, which have temporarily skewed broad average prices. While certain pockets posted solid gains, others experienced quiet dips, proving once again that real estate remains hyper local. As we head into fall, expect overall inventory and demand to settle into a more predictable rhythm.
Lastly, check out my new Fremont Super Data Tracker site, designed to bring these local market metrics to life with an interactive, visual display! Feel free to reach out if you have any questions, I'd be more than happy to do a thorough / personalized analysis beyond this data report. You can also check out my website for more resources & guides (www.joshuy.com).
Fremont - Quick takeaways (9/05/26): 📈
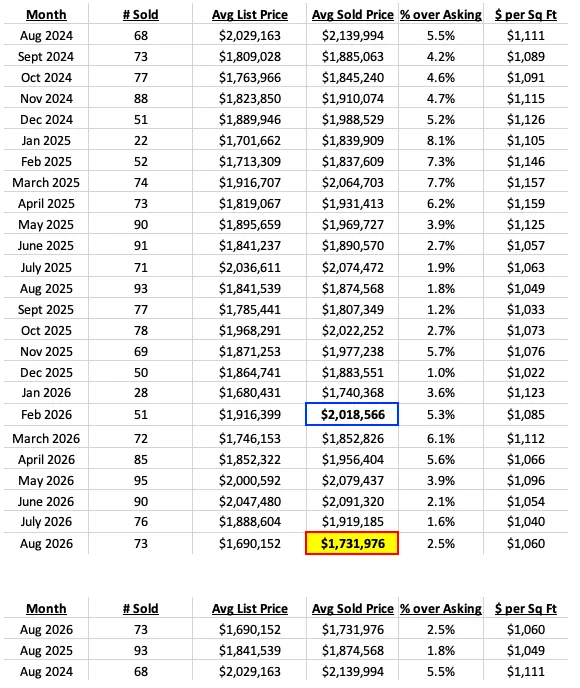
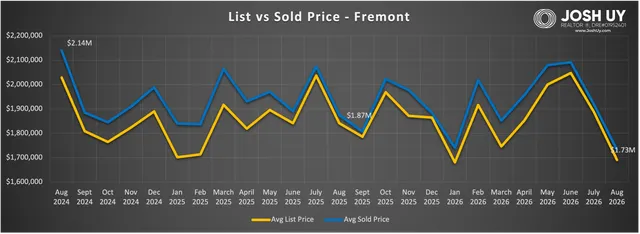
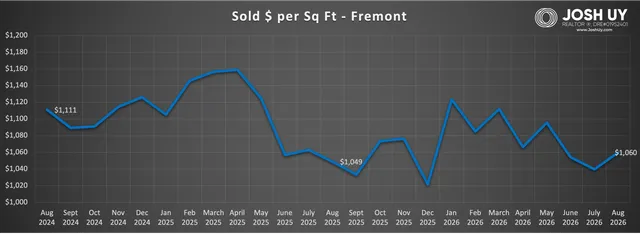
- August 2026 prices - After spending two months close to $2.1M in June & July, Fremont's price strength has taken a break and slid down to the $1.7Ms. For reference, that's a 20.7% drop with this volatile swing since June! On a closer look at the data, note though this is quite skewed as the average size of home seemed to have dropped since then (June = 2020 sq ft, July 1879 sq ft, and August 1640 sq ft). While the average size of home has been decreasing, the sold $ / sq ft figure actually increased from $1054 to $1060 / sq ft since then. Last month Fremont had 4 sales over a $3M price (compared to 7 in July, 12 in June, and 9 in May).
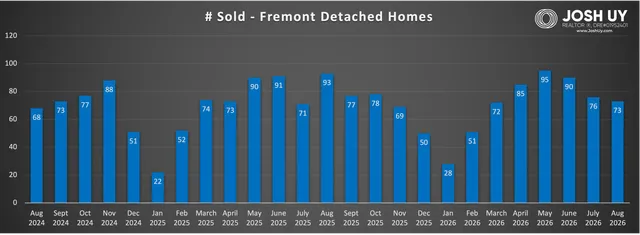
- Price over asking % - Homes in August sold at an average of 2.5% over asking, which actually broke the 4 month downtrend since peaking this year at 6.1% (in March). Of the 73 total sales last month, 43 homes (55%) closed above list price (vs 57% in July). The past couple August months have been hard to predict for pace, selling at 2.5% over this year, 1.8% over just a year ago, versus 5.5% above asking back in August 2024.
- 6 month change - Over the last six months, prices are down 14.2% from $2.02M in February 2026, mostly thanks to the July to August dip. However, the average $ / sq ft figure has fallen just 2.3% in that same timeframe (from $1085 to $1060/sq ft). For the year, July's figure at $1040 / sq ft sold is the low point, followed by June at $1054 / sq ft. With the 2 months of price dipping, the overall monthly average for 2026 now adjusts to $1.92M.
- 1 yr change - Year over year, prices are down 7.6% from $1.87M in August 2025. Fremont had 73 homes sold this past month, recording significantly less activity than 2025 (93 sales) but both more than the 2024 year (with 68 sales).
- See the August sold homes HERE.
Have a great day!
Josh Uy

Sales data was pulled from the Bayeast Association of Realtors MLS (deemed reliable but not guaranteed), then organized by Josh Uy. For more information on how these trends might affect your home values and/or the timing of your real estate moves, please feel free to contact me anytime. You can also visit my website (www.JoshUy.com) which has additional resources for home buyers and home sellers.