Fremont Real Estate Market Update: March 2025

As we spring forward into Daylight Savings this coming Sunday, the real estate market is starting to bloom with fresh opportunities! Market activity has been surging since last month, specifically a large increase in number of homes listed and recently sold. While it could be anecdotal, I've also noticed several open houses over the past weekends were quite busy, which was a big difference compared to January. Adding to the seasonal boom, mortgage rates have been quietly dipping since early February, which is helping to boost buyer affordability.
Fremont - Quick takeaways (3/04/25): 📈
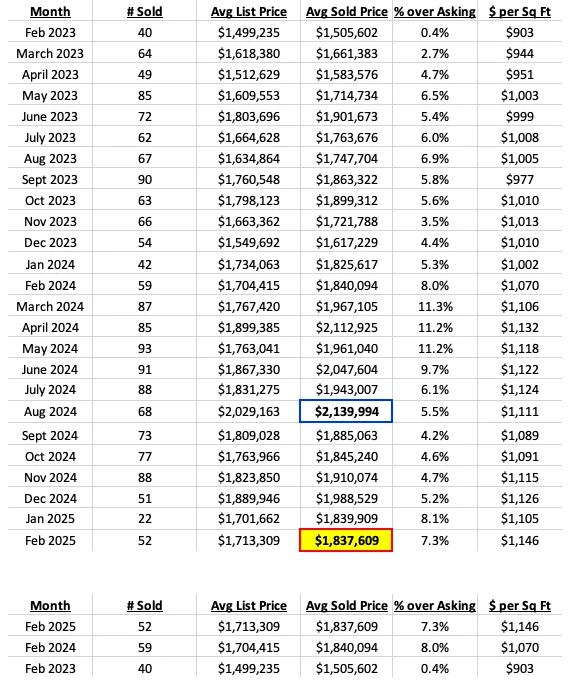
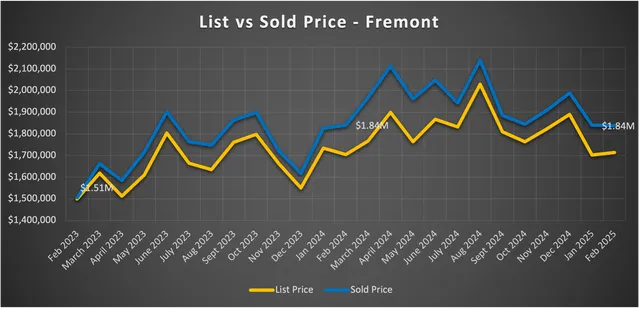
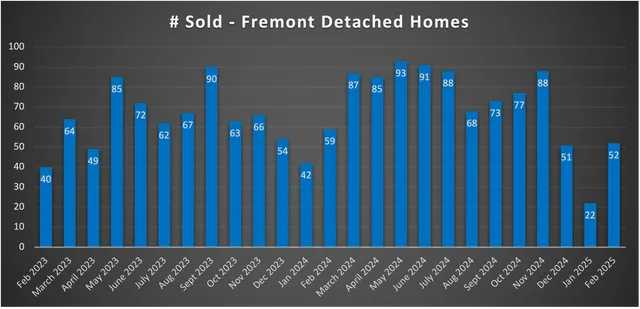
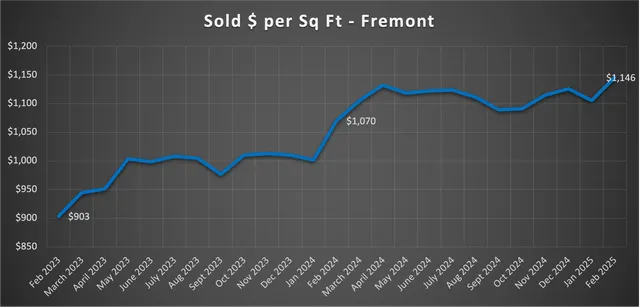
- February 2025 prices - The typical Fremont home sold for $1.84M last month, which was essentially the same average as January. While price was relatively the same, the number of homes sold increased by 2.4x! Despite the increased activity, the # of homes selling beyond $3M has now dropped to only 1 (down from 5-6 in late 2024). Interestingly, sold price per sq ft hit an all high, despite sold price not even being above $1.9M. For reference, during the high in August at $2.14M, sold price per sq ft was only at $1111 (vs $1146 now).
- Price over asking % - Homes generally sold 7.3% above asking last month, which although was a small dip from January, was still much higher than the past several months. Perhaps we may see a double digit month soon in the coming spring season.
- 6 month change - Price over 6 months is down 14.1% from $2.14M in August. Though the price average is currently at $1.84M, the signs are pointing to February as having skewed data month (# of sales exploding but somehow lacking >$3M/larger home sales, also setting a new all time high for sold price per sq ft despite price being lower), so we are likely to see the average much higher next month.
- 1 yr change - Year over year, price is essentially at the same level vs February 2024 at $1.84M. The number of homes sold this past February (52 sales) was slightly less compared to 2024 (59 sales), but both more than the slower paced 2023 (with 40 sales).
- See the Feb sold homes HERE.
Take care,
Josh Uy
Sales data was pulled from the Bayeast Association of Realtors MLS (deemed reliable but not guaranteed), then organized by Josh Uy. For more information on how these trends might affect your home values and/or the timing of your real estate moves, please feel free to contact me anytime. You can also visit my website (www.JoshUy.com) which has additional resources for home buyers and home sellers.