Fremont Real Estate Market Update: March 2026

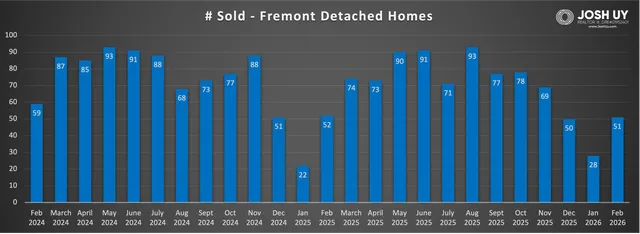
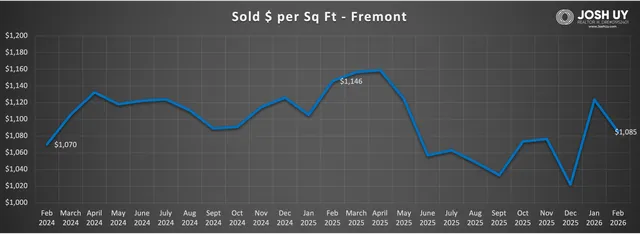
Good morning! February showed a clear trend as average sale prices rose in most areas, with some posting modest gains, and others pushing toward new all time highs. While the number of sold homes increased since January, this year’s February numbers were generally lower (or relatively similar at best) compared to the last two years. March (and sometimes April) is typically when inventory and buyer activity spike in most markets, which can either be a great opportunity or a challenge depending on your real estate goals.
As always, please feel free to reach out if you have any questions, I'd be more than happy to do a thorough / personalized analysis beyond this data report. You can also check out my website for more resources & guides (www.joshuy.com).
Fremont - Quick takeaways (3/04/26): 📈
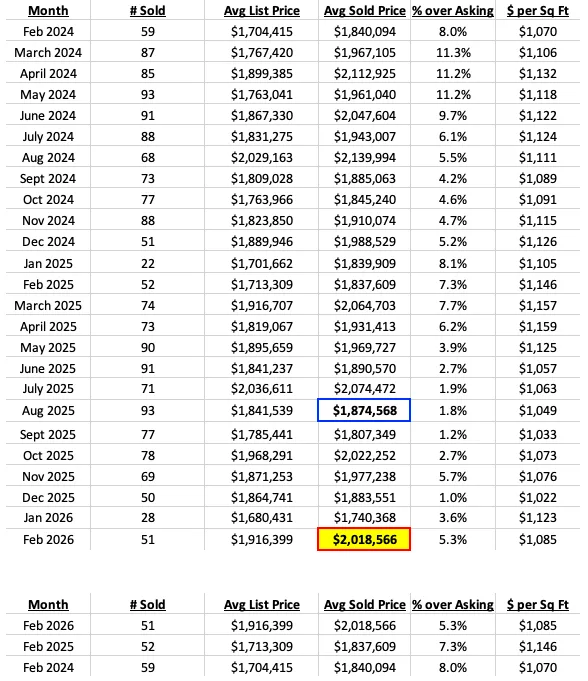
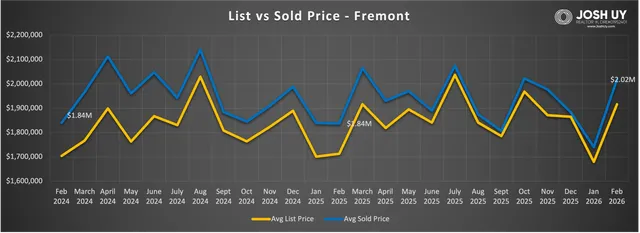
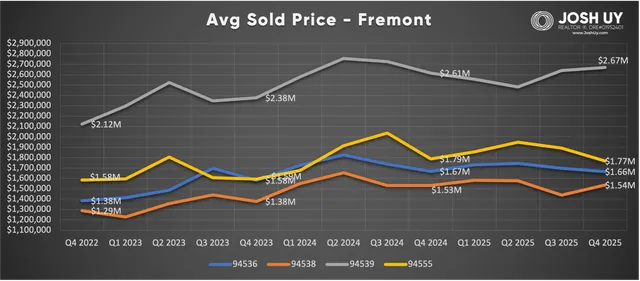
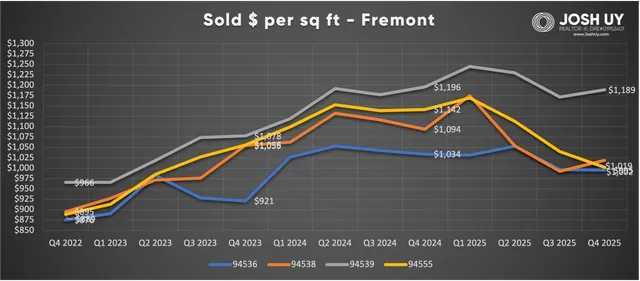
- Feb 2026 prices - After a couple months of seeing average price steadily decline, Fremont reversed the trend with a strong February, with the typical home now selling for $2.02M. For reference, that's a 16% increase for average sold price from January's numbers! Price wise, we are nearly at the same level as October 2025, which was also the last time we had an average above $2M. While the 2024 & 2025 years were relatively flat going from January to February, 2026 went against the trend with its large price increase. Number of Feb sales above $3M = 5 (vs 1 in Jan, 3 in Dec, 8 in Nov).
- Price over asking % - This figure climbed back into the 5% range (5.3%) for the first time since November 2025. Around this time last year, homes were selling at an average of 7.3%, which was followed by a slight tick up to 7.7% in March.
- 6 month change - Price over 6 months is up 7.7% from $1.875M. Since then, we have managed to break through the $2M barrier just twice, while posting a few months in the $1.8Ms (FYI the average of the months = $1.9M). Seems quite likely we will see another month this Spring with price beyond $2M.
- 1 yr change - Year over year, price is up 9.8% from $1.84M in Feb 2025. Fremont had 51 homes sold this past month, which was nearly the same as 2025 (with 52 sales), but both slightly lower than 2024 (with 59 sales).
- See the Feb sold homes HERE.
Have a great day!
Josh Uy

Sales data was pulled from the Bayeast Association of Realtors MLS (deemed reliable but not guaranteed), then organized by Josh Uy. For more information on how these trends might affect your home values and/or the timing of your real estate moves, please feel free to contact me anytime. You can also visit my website (www.JoshUy.com) which has additional resources for home buyers and home sellers.