Fremont Real Estate Market Update: August 2025

Did you know the month of August was named after one of the most influential figures of the ancient world - Augustus Caesar? Ruling as Rome’s first emperor from 27 BC to his death in 14 AD, his reign was largely free of internal armed conflict and is considered as a time of peace and prosperity.
Speaking of prosperity - many of the local real estate markets have been holding up well this summer, which is typically is a slower time for activity (mid June to early August). Feel free to reach out if you have any questions, I'd be more than happy to do a thorough / personalized analysis beyond this data. You can also check out my website for more resources & guides (www.joshuy.com).
Fremont - Quick takeaways (8/04/25): 📈
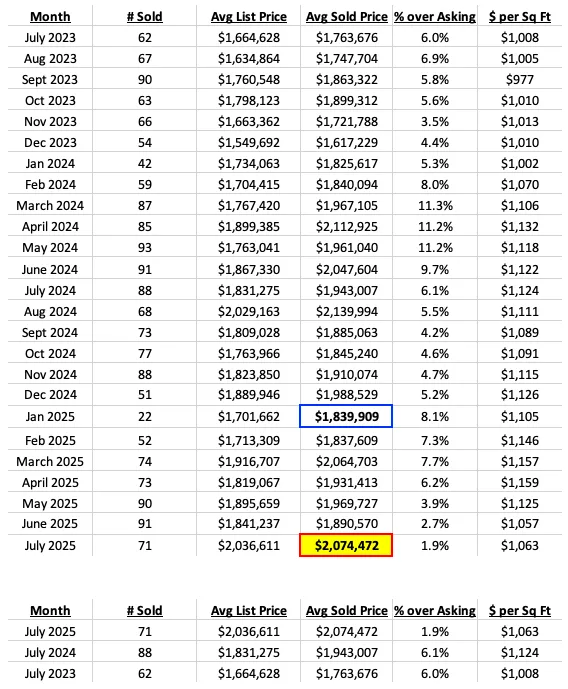
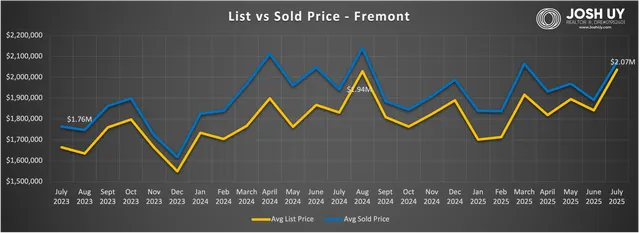
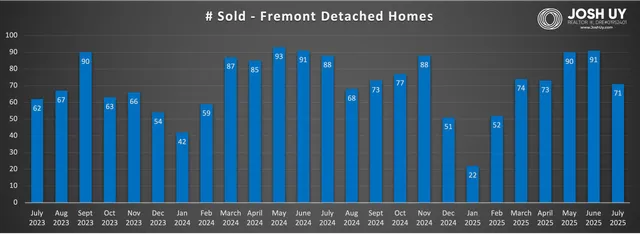
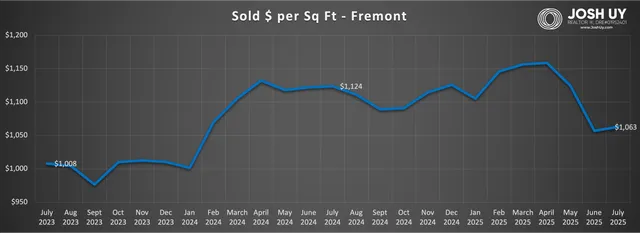
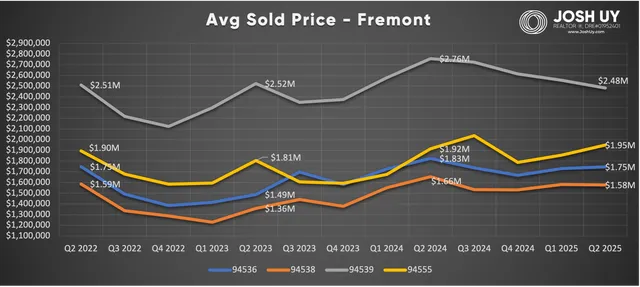
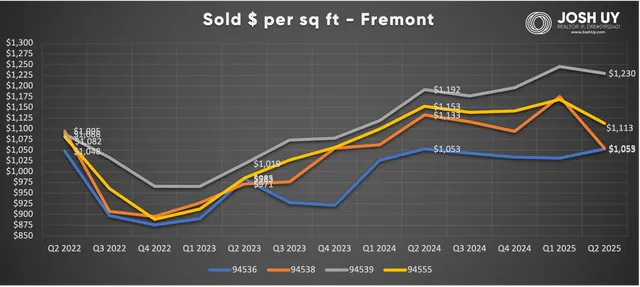
- July 2025 prices - The average Fremont home sold for $2.07M last month, which is now the new price high for the year! For reference, there were only two months that recorded a higher average: April 2024 (at $2.11M) and August 2024 (all time high at $2.14M). While price rebounded to a new 2025 high, the $ / sq ft figure did increase slightly to $1063 / sq ft, but note this was still the 2nd lowest monthly average this year. Number of July sales above $3M price = 8 (vs 5 in June, 4 in May, 2 in April, 7 in March).
- Price over asking % - Homes last month were generally selling 1.9% above asking, which was semi expected as there is usually a dropoff for the Summer months. Back in March this figure was 7.7%, which would be a 76% drop compared to now. Note the drop last year from March to July was "only" 46% (going from 11.3% to 6.1%).
- 6 month change - Price over 6 months is up 12.7% from $1.84M in January. Price has been a little volatile since then moving within a range around $1.83M-$2.07M, but is now looking to breakout and possibly retest the $2.1Ms. Fremont still has some work to do to reclaim a higher figure of > $1105/sq ft though.
- 1 yr change - Year over year, price is up 6.8% from $1.94M in 2024. The number of homes sold this past July (71 sales) fell compared to 2024 (88 sales), but was still higher compared to the 62 sold back in 2023.
- See the July sold homes HERE.
Have a great day!
Josh Uy

Sales data was pulled from the Bayeast Association of Realtors MLS (deemed reliable but not guaranteed), then organized by Josh Uy. For more information on how these trends might affect your home values and/or the timing of your real estate moves, please feel free to contact me anytime. You can also visit my website (www.JoshUy.com) which has additional resources for home buyers and home sellers.