Fremont Real Estate Market Update: June 2026

Good morning! As we head into the summer season, the economic landscape continues to evolve. Approaching the second half of 2026, the Fed has maintained a cautious yet stable interest rate stance. Within the Bay Area, we have seen a slowdown in tech sector hiring, though the stock market (particularly tech) has trended mostly positive despite some spring volatility. This mixed backdrop has left consumer confidence a bit split. Some prospective buyers are capitalizing on pockets of reduced competition, while others are navigating tighter purchasing power and reduced options. Still, the underlying theme remains the same - inventory stays tight in desirable neighborhoods, and premium, move in ready homes are still selling incredibly well.
As always, please feel free to reach out if you have any questions, I'd be more than happy to do a thorough / personalized analysis beyond this data report. You can also check out my website for more resources & guides (www.joshuy.com).
Fremont - Quick takeaways (6/05/26): 📈
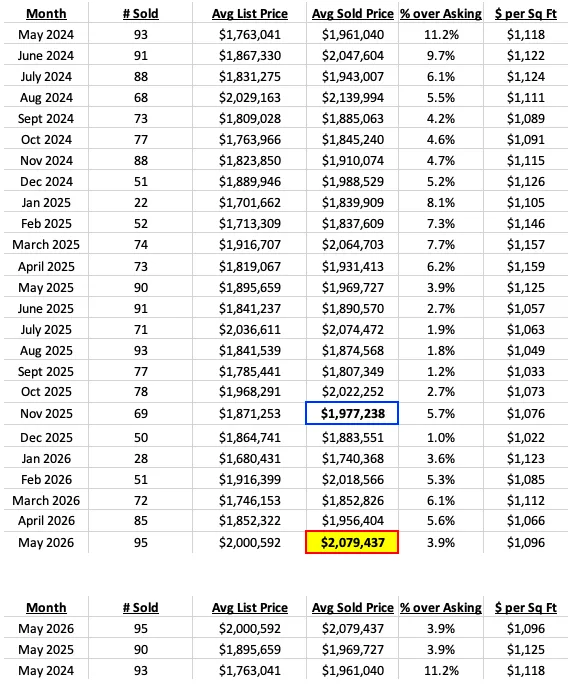
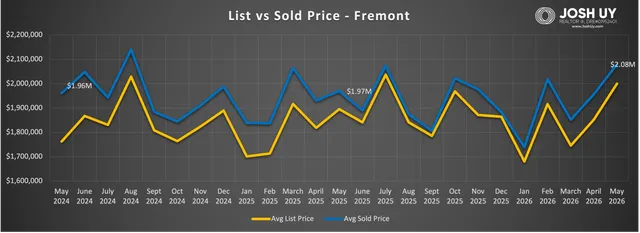
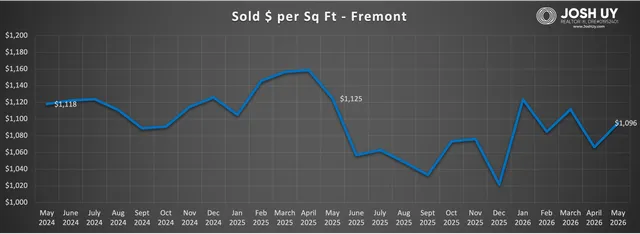
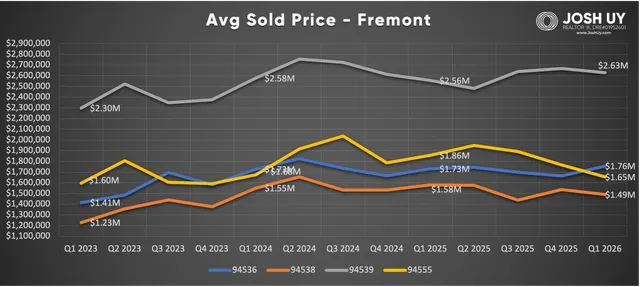
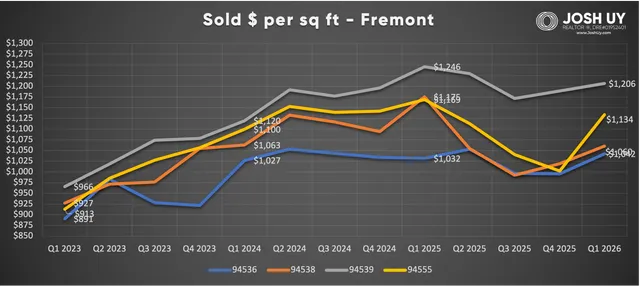
- May 2026 prices - After a modest dip in March, Fremont came back with two consecutive stronger months, with the average home now selling for $2.08M. For reference, this was a 6.3% jump from April's figure at $1.96M. The sold $ / sq ft figure also climbed to $1096 sq/ft, up slightly from $1076 in April. For the month of May, Fremont had 9 homes closing above $3M, which was a significant jump compared to the 3ish average we have seen over the past few months (vs 3 in April, 3 in March, 5 in Feb).
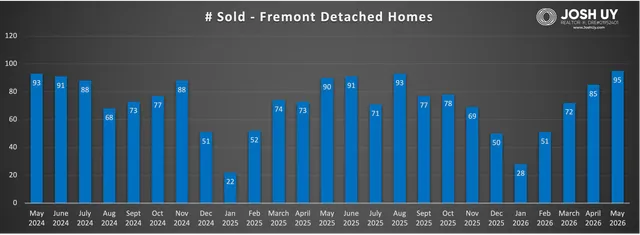
- Price over asking % - Homes in May were generally selling 3.9% above asking, a slight pullback from April's 5.6% figure. Of the 95 homes sold, 73 closed above list, 20 sold below, and 2 sold at asking, which was a healthy split but still clearly favoring sellers. Interestingly at this time last year, homes were selling at the same 3.9% over asking pace.
- 6 month change - Price over the last 6 months is up 5.2% from $1.98M in November 2025, while sold $ / sq ft gained 1.8% over that span (from $1076 to $1096 / sq ft). Though we dipped into the $1.7M - $1.8M range for a couple of months during the winter, May's strong showing pushes us solidly back above the $2M level. Note the average for the year so far continues to track upward (~$1.93M for 2026).
- 1 yr change - Year over year, price is up 5.6% from $1.97M in May 2025. Fremont had 95 homes sold this past month, which was pretty consistent with the last two years (May 2025 had 90 sales, May 2024 had 93).
- See the May sold homes HERE.
Have a great day!
Josh Uy

Sales data was pulled from the Bayeast Association of Realtors MLS (deemed reliable but not guaranteed), then organized by Josh Uy. For more information on how these trends might affect your home values and/or the timing of your real estate moves, please feel free to contact me anytime. You can also visit my website (www.JoshUy.com) which has additional resources for home buyers and home sellers.