Fremont Real Estate Market Update: November 2024

Many will be watching the next Fed meeting on November 7th to see how they follow up the September .50% rate cut. Despite the news, it did not have much effect for consumers as the cut was already priced in by the time the decision was made. The market is eager to see another reduction, most are betting on another .25% drop for this meeting. Until the mortgage rates start trending significantly downwards, we are likely to see a softer housing market with less momentum. Locally, this means many areas will see prices relatively stable or bouncing around within a range as they have been the last few months. One major difference compared to around this time last year, there’s several cities seeing much more sales activity vs 2023.
Fremont - Quick takeaways (11/04/24): 📈
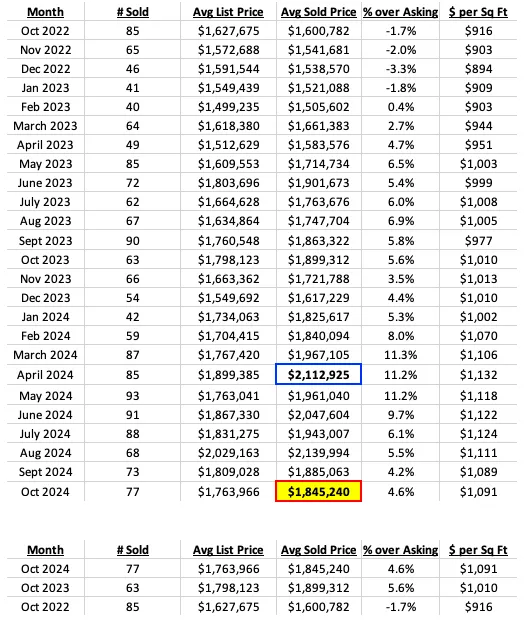
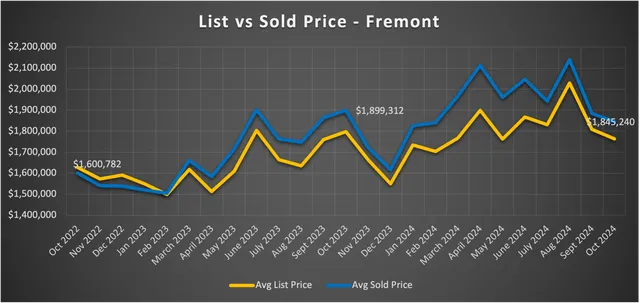
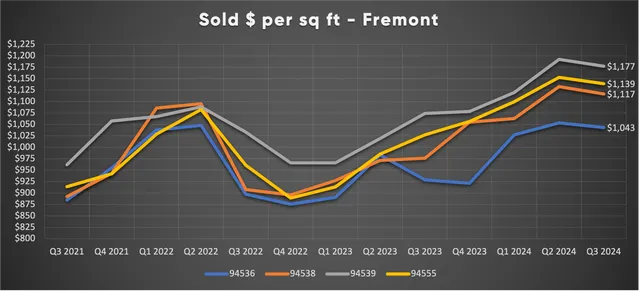
- October 2024 prices - Fremont's average for the month looked pretty similar to September, with the typical home selling slightly lower at $1.85M. On a closer look of the sales from the last two months vs the record August at $2.14M, September & October had a handful of homes selling above $3M (5 in Oct, 6 in Sept), whereas August had 10!
- Price over asking % - The average home sold 4.6% above the asking price last month, which was almost a 10% increase from last month. Despite the increase, this was still the second lowest figure recorded all year, being second to only September at 4.2%. The market is still favoring sellers in many areas, particularly so for neighborhoods with stronger school ratings.
- 6 month change - Average price over 6 months is down 12.7% from $2.11M in April. While it's been a volatile range between $1.85M-$2.14M, price has generally been on a upward trend since the start of the 2024. Unless we get significant downward movement on the rates, we may not see a price > $2M again until the spring rolls around.
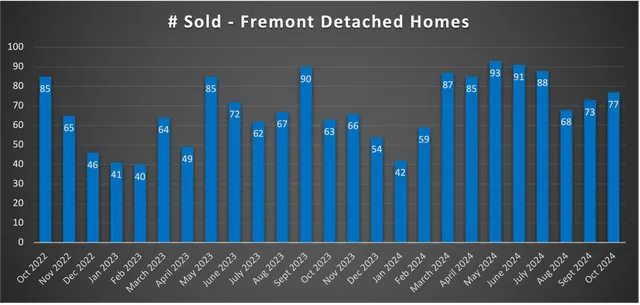
- 1 yr change - Average price is down 2.8% compared to 1 year ago at $1.9M. The number of homes sold this past October (77 sales) was more than the 63 sold in 2023, but both lower compared to the more active 2022 year with 85 sales.
- See the Oct sold homes HERE.
Take care,
Josh Uy

Sales data was pulled from the Bayeast Association of Realtors MLS (deemed reliable but not guaranteed), then organized by Josh Uy. For more information on how these trends might affect your home values and/or the timing of your real estate moves, please feel free to contact me anytime. You can also visit my website (www.JoshUy.com) which has additional resources for home buyers and home sellers.