Fremont Real Estate Market Update: April 2026

Good morning! Local home sales have stayed decently strong across most areas. Though this year’s spring hot season has been noticeably muted, the market is showing some resilience despite the turbulent times. Global uncertainty from the war, along with its ripple effects (volatile stock market & higher interest rates) have cooled the usual seasonal momentum. For motivated buyers, this creates a fantastic window of opportunity to snag great homes without facing the typical crowd of competition.
As always, please feel free to reach out if you have any questions, I'd be more than happy to do a thorough / personalized analysis beyond this data report. You can also check out my website for more resources & guides (www.joshuy.com).
Fremont - Quick takeaways (4/04/26): 📈
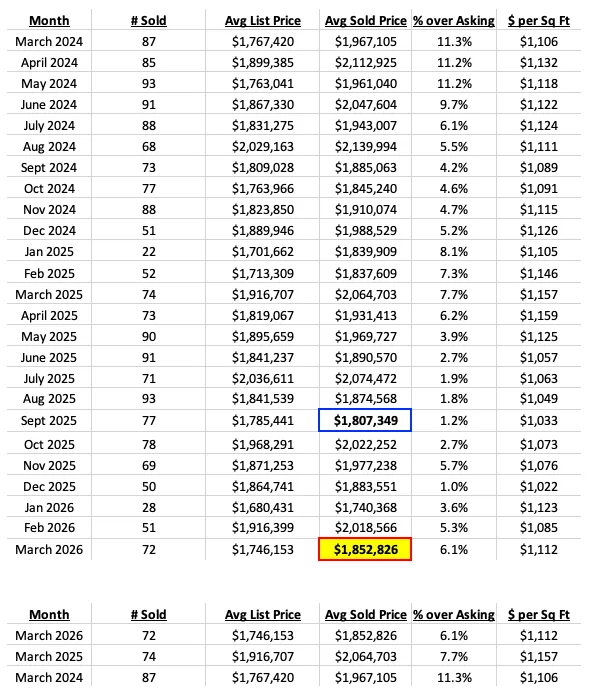
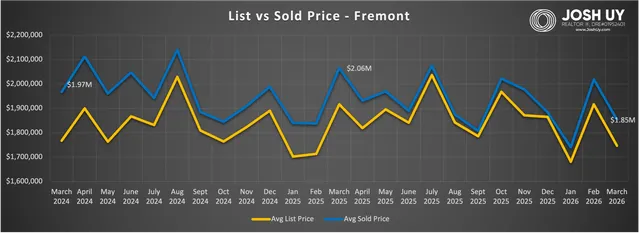
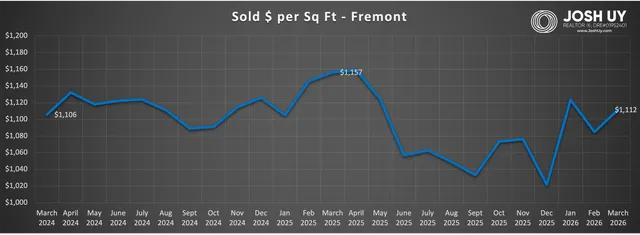
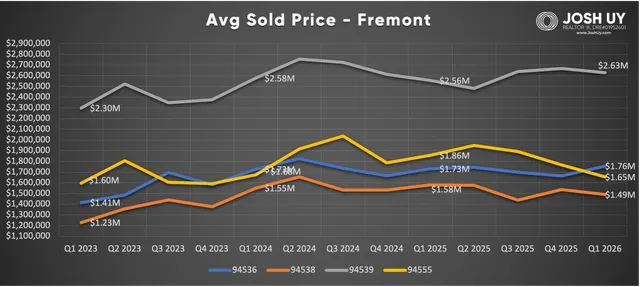
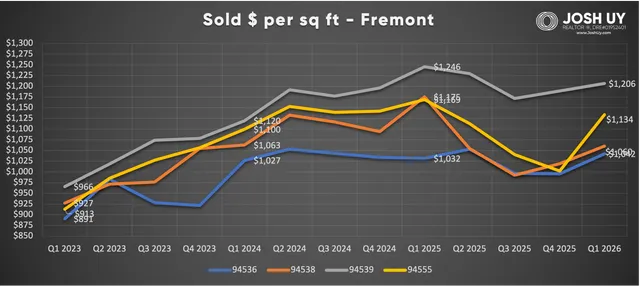
- March 2026 prices - After a strong February, Fremont's average sold price took a step back last month, with the typical home now selling for $1.85M. Note while price dipped 8.2%, the average sold $ / sq ft rose 2.5% to $1112 / sq ft. Price wise, we are just under the level from December at $1.88M, also note the average of the 3 months this year = $1.87M. Number of March sales above $3M = 3 (vs 5 in Feb, 1 in Jan).
- Price over asking % - Homes on average last month were selling 6.1% above list price. Though its typical to see this figure increase from February to March, this year's jump might have been slightly muted due to recent geopolitical events. For reference, homes were selling even higher over asking the last two years, at 7.7% above in March 2025 and 11.3% above in March 2024.
- 6 month change - Despite the dip, price over 6 months is still up 2.5% from $1.81M. Since then, we have managed to break through the $2M barrier just twice, while posting a few months in the $1.7Ms-$1.8Ms (FYI the average of the months still = $1.9M). Note while average price is up 2.5% since Sept 2025, the sold $ / sq ft has increased 7.6%!
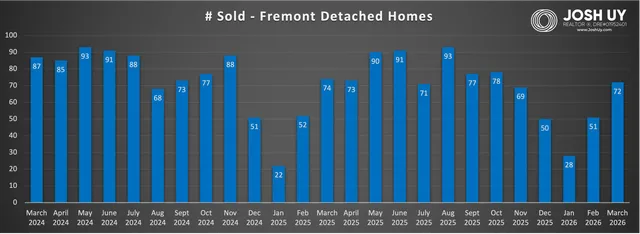
- 1 yr change - Year over year, price is down 10.3% from $2.06M in March 2025. Fremont had 72 homes sold this past month, which was just under 2025's activity (74 sales), but both much less than 2024 (87 sales).
- See the March sold homes HERE.
Have a great day!
Josh Uy
Sales data was pulled from the Bayeast Association of Realtors MLS (deemed reliable but not guaranteed), then organized by Josh Uy. For more information on how these trends might affect your home values and/or the timing of your real estate moves, please feel free to contact me anytime. You can also visit my website (www.JoshUy.com) which has additional resources for home buyers and home sellers.